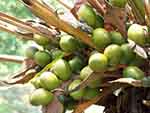
The overall value of exported palm oil decreased by an average -2.4% for all exporters since five years earlier in 2021 when palm oil shipments were valued at $49.9 billion.
Over the latest annual period, international sales of palm oil accelerated by 16.9% compared to $41.7 billion for 2024.
Used in food, cosmetics and as bio-fuel, worldwide demand for palm oil is robust. Indonesia remains as the market leader for supplying palm oil to international customers.
Global suppliers of palm oil are intensely concentrated. The 2 biggest exporters, Indonesia and Malaysia, generated four-fifths (80.6%) of the value for all palm oil exported in 2025.
From a continental perspective, Asian countries attracted the highest dollar worth of sales from exported palm oil during 2025 with shipments valued at $41.6 billion or 85.3% of the global total. In second place were exporters in Europe at 5.6% while another 5.2% of worldwide palm oil shipments originated from Latin American countries excluding Mexico but including the Caribbean.
Smaller percentages came from suppliers in Oceanian countries (1.8%) led by Papua New Guinea, Solomon Islands and Australia, Africa (1.7%), then North America (0.4%).
For research purposes, the 4-digit Harmonized Tariff System code prefix for palm oil is 1511.
Palm Oil Exports by Country
Below are the 15 countries that exported the highest dollar value worth of palm oil during 2025.
- Indonesia: US$24.4 billion (50.1% of palm oil exports)
- Malaysia: $14.8 billion (30.5%)
- Thailand: $1.41 billion (2.9%)
- Netherlands: $1.28 billion (2.6%)
- Papua New Guinea: $866.4 million (1.8%)
- Colombia: $811.5 million (1.7%)
- Guatemala: $622.1 million (1.3%)
- Honduras: $395.1 million (0.8%)
- Germany: $311.7 million (0.6%)
- Italy: $296.9 million (0.6%)
- Estonia: $249.6 million (0.5%)
- Costa Rica: $240 million (0.5%)
- Ivory Coast: $208.7 million (0.4%)
- Oman: $205.3 million (0.4%)
- Denmark: $168 million (0.3%)
By value, the listed 15 countries shipped 95.1% of global palm oil exported in 2025.
Among the top exporters, the fastest-growing palm oil exporters since 2024 were: Colombia (up 83.6%), Thailand (up 61.7%), Oman (up 39.9%) and Papua New Guinea (up 28.1%).
Those countries that posted declines in their exported palm oil sales were: Ivory Coast (down -32.9% from 2024), Estonia (down -12%), Italy (down -5.5%) and Honduras (down -0.4%).
Countries Generating Largest Palm Oil Trade Surpluses
The following countries posted the highest positive net exports for palm oil during 2025. Investopedia defines net exports as the value of a country’s total exports minus the value of its total imports. Thus, the statistics below present the surplus between the value of each country’s exported palm oil and its import purchases for that same commodity.
- Indonesia: US$24.4 billion (net export surplus up 22% since 2024)
- Malaysia: $14 billion (up 5%)
- Thailand: $1.4 billion (up 61.5%)
- Papua New Guinea: $835.5 million (up 27%)
- Colombia: $677.3 million (up 113.5%)
- Guatemala: $551.5 million (up 21%)
- Honduras: $277.6 million (down -12%)
- Costa Rica: $230.1 million (up 12.6%)
- Ivory Coast: $181.7 million (down -37.9%)
- Ecuador: $151.4 million (up 7%)
- Peru: $138.5 million (up 32.9%)
- Panama: $71.2 million (up 73%)
- Cambodia: $42.7 million (up 2.4%)
- Gabon: $35.3 million (down -74.2%)
- Solomon Islands: $27 million (up 60.2%)
World palm oil exporter leader Indonesia attains the highest surplus in the international trade of palm oil. In turn, this positive cashflow confirms Indonesia’s strong competitive advantage for this specific product category.
Countries Posting Worst Palm Oil Trade Deficits
The following countries posted the highest negative net exports for palm oil during 2025. Investopedia defines net exports as the value of a country’s total exports minus the value of its total imports. Thus, the statistics below present the deficit between the value of each country’s imported palm oil purchases and its exports for that same commodity.
- India: -US$8.3 billion (net export deficit down -4.1% since 2024)
- Pakistan: -$3.7 billion (up 27.5%)
- mainland China: -$3.5 billion (up 3.4%)
- Bangladesh: -$1.71 billion (up 30.7%)
- United States: -$1.65 billion (down -4.3%)
- Egypt: -$1.5 billion (up 19.6%)
- Philippines: -$1.4 billion (up 44.9%)
- Vietnam: -$1.1 billion (up 9.8%)
- Russia: -$973.9 million (up 18.6%)
- Kenya: -$940.2 million (up 17.6%)
- Saudi Arabia: -$770.3 million (up 8.5%)
- Myanmar: -$753.4 million (up 33.9%)
- Japan: -$747.1 million (up 14.4%)
- Türkiye: -$733.6 million (up 15.8%)
- United Arab Emirates: -$698.5 million (down -29.0%)
Highly populated India incurred the highest deficit in the international trade of palm oil. In turn, this negative cashflow highlights India’s strong competitive disadvantage for this specific product category but also signals opportunities for palm oil-supplying countries that help satisfy the powerful demand.
Palm Oil Exporting Companies
According to global trading platform Alibaba, the following companies are top-rated examples of palm oil-trading companies located in the country shown within parentheses.
- Erapoly Global Sdn. BHD (Malaysia)
- Foshan Shunde Guoxin Ind. Co., Limited (China)
- MUZ Trading (Philippines)
- Novagen Genetica LtdA-EPP (Brazil)
- Passata Trading GmbH (Germany)
- Pt. Asianagro Agungjaya (Indonesia)
See also Palm Oil Imports by Country, Indonesia’s Top 10 Exports, Indonesia’s Top Trading Partners, Malaysia’s Top Trading Partners and Netherlands Top Trading Partners
Research Sources:
Alibaba, Supplier information for palm oil. Accessed on July 12, 2026
Central Intelligence Agency, The World Factbook Field Listing: Exports – Commodities. Accessed on July 12, 2026
Forbes 2021 Global 2000 rankings, The World’s Biggest Public Companies. Accessed on July 12, 2026
International Trade Centre, Trade Map. Accessed on July 12, 2026
Investopedia, Net Exports Definition. Accessed on July 12, 2026
Wikipedia, Palm oil. Accessed on July 12, 2026