That dollar amount results from an average 24.2% increase for all international sellers of artificial joints over the 5-year period starting from $12 billion in 2019.
Year over year, the value of globally exported artificial joints rose by 13.5% compared to $13.2 billion starting from 2022.
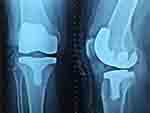
As the massive cohort of baby boomers continues to age, the number of surgeries for artificial knee, hip, ankle and other joint replacement continues to accelerate at a steady pace.
The 5 biggest exporters of artificial joints by value are the Netherlands, Ireland, United States of America, Switzerland and Belgium. Combined, that quintet of leading suppliers generated just over two-thirds (67.7%) of artificial joints sold on international markets during 2023.
Among continents, exporters in Europe sold the highest dollar worth of exported artificial joints during 2023 with shipments valued at $12.3 billion or over four-fifths (82.2%) of overall exports for these highly specialized limb-related replacements. In second place were suppliers in North America at 12.2% while another 5.4% of worldwide artificial joints shipments originated from Asia.
Tinier percentages came from Oceania (0.1%) mostly Australia, then Latin America (0.05%) including the Caribbean, and Africa (0.03%).
For research purposes, artificial joints for orthopedic purposes are classified under 902131, a 6-digit Harmonized Tariff System code prefix.
Top Artificial Joints Exporters by Country
Below are the 15 countries that exported the highest dollar value worth of artificial joints during 2023.
- Netherlands: US$3.2 billion (21.4% of exported artificial joints)
- Ireland: $2.3 billion (15.2%)
- United States: $1.8 billion (12.2%)
- Switzerland: $1.5 billion (10.3%)
- Belgium: $1.29 billion (8.6%)
- Germany: $1.25 billion (8.4%)
- United Kingdom: $1.19 billion (8%)
- France: $677.4 million (4.5%)
- mainland China: $447.8 million (3%)
- Italy: $399.4 million (2.7%)
- Austria: $167.1 million (1.1%)
- Singapore: $144.1 million (1%)
- Iceland: $105.4 million (0.7%)
- India: $68.3 million (0.5%)
- Taiwan: $51.5 million (0.3%)
By value, the listed 15 countries shipped 97.8% of globally exported artificial joints in 2023.
Among the top exporters, the fastest-growing exporters of artificial joints since 2022 were: Austria (up 132.7%), Iceland (up 130%), mainland China (up 52.1%) and India (up 50.5%).
Belgium was the lone leading supplier that posted a decline in its international sales of artificial joints, recording a -7% setback from 2022.
Countries Earning Trade Surpluses from Artificial Joints
The following countries posted the highest positive net exports for artificial joints during 2023. Investopedia defines net exports as the value of a country’s total exports minus the value of its total imports. Thus, the statistics below present the surplus between the value of each country’s exported artificial joints and its import purchases for that same commodity.
- Ireland: US$1.9 billion (net export surplus up 2.2% since 2022)
- Netherlands: $1.1 billion (up 28.9%)
- Switzerland: $924.3 million (up 1.5%)
- Germany: $472.7 million (up 79.5%)
- United Kingdom: $384 million (up 120.7%)
- France: $138.4 million (up 39%)
- Iceland: $102.9 million (up 137.5%)
- Belgium: $56.5 million (down -59.1%)
- Singapore: $13.6 million (down -24.3%)
- Taiwan: $11.2 million (up 0.5%)
- Georgia: $3.1 million (down -17%)
- US Minor Outlying Islands: $266,000 (up 114.5%)
- Nauru: $76,000 (2022 data unavailable)
- Afghanistan: $19,000 (up 171.4%)
- Guinea: $18,000 (2022 data unavailable)
Ireland generated the highest surplus in the international trade of artificial joints. In turn, this positive cashflow confirms Ireland’s strong competitive advantages for this specific product category.
Countries Incurring Trade Deficits from Artificial Joints
The following countries posted the highest negative net exports for artificial joints during 2023. Investopedia defines net exports as the value of a country’s total exports minus the value of its total imports. Thus, the statistics below present the deficit between the value of each country’s imported artificial joints purchases and its exports for that same commodity.
- United States: -US$1.3 billion (net export deficit up 5.9% since 2022)
- Japan: -$546.9 million (up 13.4%)
- Australia: -$386.7 million (up 11.5%)
- Canada: -$199.1 million (up 21.8%)
- Spain: -$177 million (up 6.6%)
- Russia: -$139.6 million (up 12.9%)
- Iran: -$113 million (up 53.3%)
- Italy: -$107.8 million (up 57.7%)
- India: -$104 million (down -14%)
- Poland: -$74.9 million (up 9.8%)
- Brazil: -$68.8 million (up 13.2%)
- China: -$67.2 million (down -67.3%)
- South Korea: -$66.3 million (down -11.5%)
- South Africa: -$64.3 million (up 13.6%)
- New Zealand: -$62.9 million (up 29.2%)
The United States of America incurred the highest deficit in the international trade of artificial joints. In turn, this negative cashflow highlights America’s strong competitive disadvantage for this specific product category but also signals opportunities for artificial joints-supplying countries that help satisfy the powerful consumer demand.
Artificial Joints Exporting Companies
Below are artificial joints-manufacturing conglomerates headquartered in the United States. They are presented in order of greatest market capitalization, according to Morningstar’s analysis of industry peers.
- Stryker Corp
- Abbott Laboratories
- Boston Scientific
- Intuitive Surgical Inc
- Zimmer Biomet Holdings Inc
- Edwards Lifesciences Corp
- St Jude Medical Inc
- Smith & Nephew PLC
- Varian Medical Systems Inc
- Sonova Holding AG
According to global trading platform Alibaba, the following are examples of exporters that supply artificial joints. The home-country location for each business is shown within parentheses.
- Shijiazhuang City Huirong Stainless Steel Products (China)
- Daiya Industry Co Ltd (Japan)
- Standard Steel (India)
- Medimsa Medical Production Industry (Turkey)
- DOO Ortopedija Nis (Serbia)
- Biomecanica Orthopedic Industry Ltd (Brazil)
See also Top Industrial Robots Exporters, Electronic Circuit Component Exports by Country and Heart Pacemaker Export Sales by Country.
Research Sources:
Alibaba, Supplier showroom for artificial joints. Accessed on December 23, 2024
Central Intelligence Agency, The World Factbook Field Listing: Exports – Commodities. Accessed on December 23, 2024
Forbes Global 2000 rankings, The World’s Biggest Public Companies. Accessed on December 23, 2024
International Trade Centre, Trade Map. Accessed on December 23, 2024
Investopedia, Net Exports Definition. Accessed on December 23, 2024
Morningstar, Industry Peers for Stryker Corp. Accessed on December 23, 2024