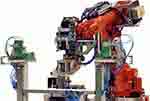
The overall value of exported industrial robots in 2022 rose by an average 12.7% for all exporting countries since 2018 when total shipments of industrial robots were valued at $6.17 billion.
Year over year, export sales of industrial robots flatlined by a 0.6% gain compared to $6.91 billion for 2021.
The 5 biggest suppliers of industrial robots on international markets are Japan, Germany, mainland China, United States of America, and Denmark. That quintet of leading robot exporters accounted for more than three-fifths (62.3%) of globally exported industrial robots in 2022. Such a high percentage indicates a relatively concentrated set of market providers.
From a continental perspective, suppliers in Asia sold the highest value in exported industrial robots worth $3.5 billion or about half (50.5%) of the global total. In second place were sellers in Europe at 40.9%, trailed by exporters of industrial robots in North America at 8.3%.
Tinier percentages came from providers in Oceania (0.2%) mostly Australia and New Zealand, Latin America (0.1%) excluding Mexico but including the Caribbean, and Africa (0.07%).
For research purposes, the 6-digit Harmonized Tariff System code prefix is 847950. That sub-code is specific to industrial robots used for multiple purposes.
Top Industrial Robots Exporters
Below are the 25 countries that exported the highest dollar value worth of industrial robots during 2022.
- Japan: US$2.5 billion (36% of exported industrial robots)
- Germany: $725.7 million (10.4%)
- China: $407.7 million (5.9%)
- United States: $374.7 million (5.4%)
- Denmark: $320.3 million (4.6%)
- Italy: $317.6 million (4.6%)
- France: $311.6 million (4.5%)
- South Korea: $189.4 million (2.7%)
- Austria: $163 million (2.3%)
- United Kingdom: $161.3 million (2.3%)
- Sweden: $160.5 million (2.3%)
- Taiwan: $143.4 million (2.1%)
- Netherlands: $128.2 million (1.8%)
- Canada: $124.3 million (1.8%)
- Singapore: $107 million (1.5%)
- Finland: $98.9 million (1.4%)
- Spain: $93.5 million (1.3%)
- Mexico: $78.5 million (1.1%)
- Belgium: $77.9 million (1.1%)
- Luxembourg: $62.2 million (0.9%)
- Switzerland: $57.2 million (0.8%)
- Malaysia: $44.9 million (0.6%)
- Slovenia: $35.2 million (0.5%)
- Hong Kong: $25.8 million (0.4%)
- Türkiye: $25 million (0.4%)
By value, the listed countries shipped 96.9% of global industrial robots exported in 2022.
Among the top exporters, the fastest-growing exporters of industrial robots since 2021 were: Malaysia (up 363.9%), Mexico (up 218.3%), Finland (up 50.4%) and Canada (up 44.4%).
Those countries that posted declines in their international sales of industrial robots were led by: Hong Kong (down -42.2% from 2021), Italy (down -18.7%), Singapore (down -17.2%), Switzerland (down -16.8%), ) and Slovenia (down -7.4%).
Countries Earning Best Trade Surpluses from Industrial Robots
The following countries posted the highest positive net exports for industrial robots during 2022. Investopedia defines net exports as the value of a country’s total exports minus the value of its total imports. Thus, the statistics below present the surplus between the value of each country’s exported industrial robots and its import purchases for that same commodity.
- Japan: US$2.4 billion (net export surplus up 26.5% since 2021)
- Germany: $302.5 million (up 37.4%)
- Denmark: $290.9 million (up 28.5%)
- France: $132.3 million (down -29%)
- Finland: $83.7 million (up 171.1%)
- Sweden: $79.3 million (down -33.5%)
- Austria: $63.6 million (down -50.8%)
- Italy: $58.3 million (down -71.7%)
- United Kingdom: $35.6 million (down -433.8%)
- Luxembourg: $27.2 million (down -29.3%)
- Belgium: $21.7 million (down -439.1%)
- Slovenia: $15.2 million (down -190.9%)
- Bahrain: $15 million (down -3,389%)
- Taiwan: $13.2 million (down -30.1%)
- Bulgaria: $11.1 million (up 280.6%)
Japan earned the highest surplus in the international trade of industrial robots. In turn, this positive cashflow confirms Japan’s strong competitive advantage for this specific product category.
Countries Incurring Worst Trade Deficits from Industrial Robots
The following countries posted the highest negative net exports for industrial robots during 2022. Investopedia defines net exports as the value of a country’s total exports minus the value of its total imports. Thus, the statistics below present the deficit between the value of each country’s import purchases of industrial robots and its exports for that same commodity.
- China: -US$967.7 million (net export deficit up 10.1% since 2021)
- United States of America: -$165.3 million (down -30.3%)
- Mexico: -$115.1 million (down -18.8%)
- Türkiye: -$112.7 million (up 56.2%)
- Czech Republic: -$110.4 million (down -26.5%)
- India: -$76.7 million (down -64%)
- Poland: -$61.6 million (down -22.7%)
- Malaysia: -$58.9 million (down -21.6%)
- Vietnam: -$58.2 million (down -409.6%)
- Brazil: -$52.8 million (down -42.6%)
- Thailand: -$51.3 million (up 6.9%)
- Slovakia: -$44.8 million (down -57.9%)
- Russia: -$41.6 million (up 53.9%)
- Switzerland: -$41.2 million (up 34.2%)
- Indonesia: -$40.1 million (up 0.3%)
Mainland China incurred the highest deficit in the international trade of industrial robots. In turn, this negative cashflow highlights China’s competitive disadvantage for this specific product category but also signals opportunities for industrial robots-supplying countries that help satisfy the powerful demand.
Top Robotics Exporting Companies
According to PlantAutomation-Technology.com, the following businesses comprise the world’s top industrial robotics companies.
- ABB Group (Switzerland)
- Adept Technology Inc (United States)
- Apex Automation and Robotics (Australia)
- Aurotek Corp (Taiwan)
- Fanuc Corp (Japan)
- Kawasaki Robotics Inc (Japan)
- Mitsubishi (Japan)
- Rockwell Automation Inc (United States)
- Stäubli (Switzerland)
- Yaskawa Electric Corp (Japan)
See also Top Surveying Equipment Exporters by Country, Heart Pacemaker Export Sales by Country, Top Artificial Joints Exporters by Country and Hearing Aids Importers by Country
Research Sources:
Central Intelligence Agency, The World Factbook Field Listing: Exports – Commodities. Accessed on September 12, 2023
Forbes Global 2000 rankings, The World’s Biggest Public Companies. Accessed on September 12, 2023
International Trade Centre, Trade Map. Accessed on September 12, 2023
Investopedia, Net Exports Definition. Accessed on September 12, 2023
PlantAutomation-Technology.com, Top Industrial Robotics Companies. Accessed on September 12, 2023
Zepol’s company summary highlights by HTS code. Accessed on September 12, 2023
